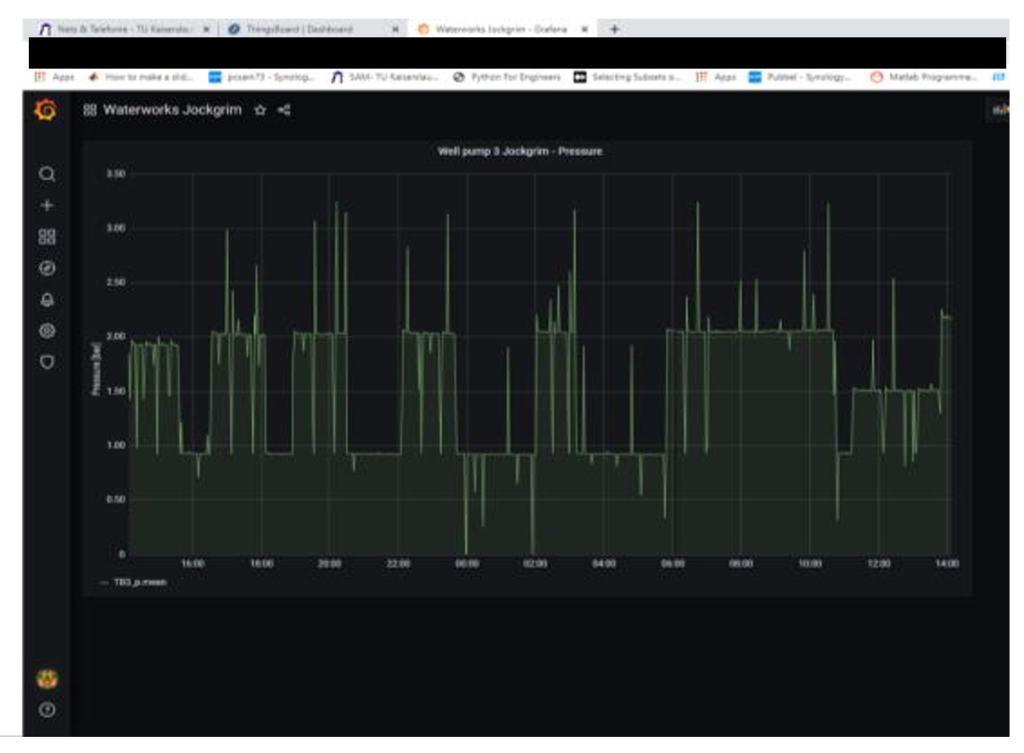
To visualise the data transmitted by the LoRaWAN devices, the IoT dashboard Grafana was put into operation. The data is written with a Node-Red Flow from the LoRaWAN server into an InfluxDB database and then visualised with Grafana. For this purpose, a server was set up that is accessible to all project partners. This enables the visualisation of measurement data from the different locations of the project partners.